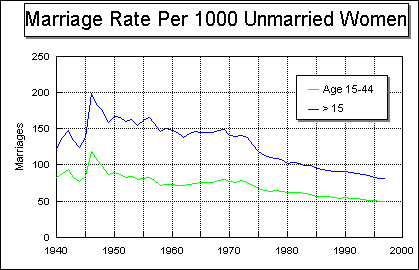
MARRIAGE STATISTICS1,2


CONCLUSIONS
| Cycle |
Year |
Marriages |
Rate/1000* |
Meaning |
| 1 |
...-1940 |
1,500K |
82 |
Marriage Highest Rate (1946 Peak) |
| 2 |
1940-1960 |
1,500K |
78 |
Decline in Marriage Rate after 1946 |
| 3 |
1960-1980 |
1,900K |
69 |
Linear Decline in Marriage Rate |
| 4 |
1980-1997 |
2,400K |
55** |
Linear Decline in Marriage Rate |
1. The charts show a peak in Marriage Rate in 1946 (due to the aftermath
of War II).
2. After 1946, there is steady decline in the Marriage Rate that after
1948 becomes basically linear.
* Notes: The numbers in the Table of Conclusions are rounded means.
The Marriage Rate is the rate per 1000 Unmarried Women greater than age
15, e.g. in 1993 there were 52.3** marriages per 1000 Unmarried Women greater
than age 15.
References
1. Clarke, Sally C. Advance Report of Final Divorce Statistics, 1989 and
1990. Monthly Vital Statistics Report, Vol. 43, No. 12, Supplement. Hyattsville,
Maryland: National Center for Health Statistics. July 14, 1995. http://www.cdc.gov/nchswww/products/pubs/pubd/mvsr/supp/44-43/44-43.htm#43_12s
2. National Center for Health Statistics. Births, marriages, divorces,
and deaths for November
1996 and July 1998. Monthly vital statistics report; vol 45 no 11 and
vol 46 no 12. Hyattsville, Maryland: National Center for Health Statistics.
1997, 1998.
http://www.cdc.gov/nchswww/products/pubs/pubd/mvsr/mvsr/46-45/46-45.htm
http://www.cdc.gov/nchswww/data/mvs46_12.pdf
All material appearing in this report is in the public domain and may
be reproduced or copied without permission.
Revised August 31, 1998
AUTHOR: Larry Wood


