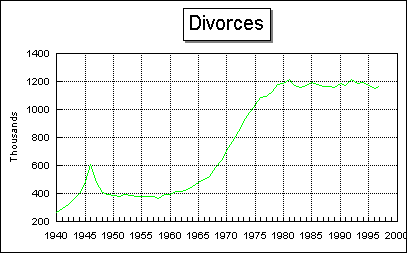
DIVORCE STATISTICS1


CONCLUSIONS
| Cycle |
Year |
Divorces |
Ratio M/D |
Meaning |
| 1 |
...-1940 |
250,000 |
6 |
Marriage Stability |
| 2 |
1940-1960 |
400,000 |
4 |
Camels: Bureaucratic Bullies, War II Parental Failures |
| 3 |
1960-1980 |
800,000 |
3 |
Horses: Baby Boom Divorcers: Adulterers |
| 4 |
1980-1997 |
1.2 m |
2 |
Mules: Stubborn Antimarriage Rebellion |
1. The peak in divorces in 1946 when the number of marriages also peaked
is obviously a preview of coming attractions. The stress of transition
from a Military Establishment to a Civilian Establishment obviously took
a heavy toll on the Marriage Culture.
2. The rise in divorces from 1960 to 1980 is a significant transition.
3. The ratio of marriages to divorces (M/D) shows a series of steps
down that correspond to 20 year cycles (the length of a generation).
4. The M/D ratio of marriages to divorces clearly
shows that divorces (i.e. marriage failures) have become a serious epidemic!
References
1. Clarke, Sally C. Advance Report of Final Divorce Statistics, 1989 and
1990. Monthly Vital Statistics Report, Vol. 43, No. 9, Supplement. Hyattsville,
Maryland: National Center for Health Statistics. March 22, 1995. http://www.cdc.gov/nchswww/products/pubs/pubd/mvsr/supp/44-43/44-43.htm#43_9s
2. National Center for Health Statistics. Births, marriages, divorces,
and deaths for November
1996 and July 28, 1998. Monthly vital statistics report; vol
45 no 11 and vol 46 no 12. Hyattsville, Maryland: National Center for Health
Statistics. 1997, 1998.
http://www.cdc.gov/nchswww/products/pubs/pubd/mvsr/mvsr/46-45/46-45.htm
http://www.cdc.gov/nchswww/data/mvs46_12.pdf
All material appearing in this report is in the public domain and may
be reproduced or copied without permission.
Revised August 31, 1998
AUTHOR: Larry Wood


